Table Of Content
Did you know? According to the CNCF Annual Survey, over 90% of organizations use Kubernetes in production, making observability one of the biggest operational priorities for modern DevOps teams. Even a few minutes of downtime can impact application availability, customer experience, and business revenue.
What is Kubernetes Monitoring with Prometheus and Grafana?
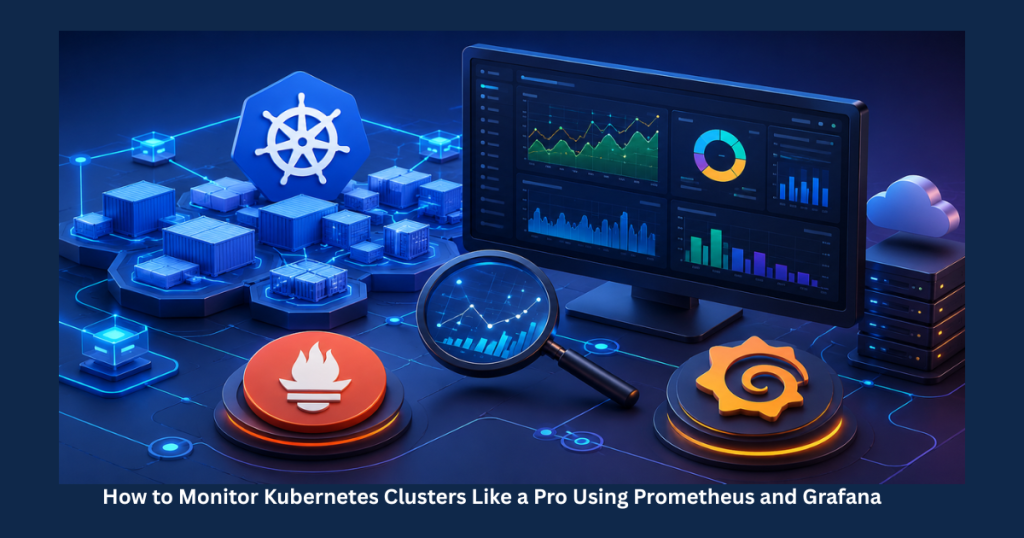
Kubernetes Monitoring with Prometheus and Grafana is the process of collecting, analyzing, and visualizing real-time metrics from Kubernetes clusters to monitor infrastructure health, application performance, resource utilization, and system availability. Prometheus gathers metrics from Kubernetes components, while Grafana transforms those metrics into interactive dashboards and alerts, enabling proactive issue detection and faster incident response.
Why Kubernetes Monitoring Matters
Running Kubernetes without monitoring is like driving a car without a dashboard. While workloads may appear healthy, hidden resource bottlenecks, failing pods, or networking issues can quickly escalate into production outages.
Modern organizations require continuous Kubernetes Cluster Monitoring to ensure applications remain reliable, scalable, and cost-efficient.
Why It Matters
Without proper monitoring, teams often face:
- Unexpected application downtime
- Slow response times affecting customer experience
- High infrastructure costs due to over-provisioned resources
- Delayed troubleshooting because of limited visibility
- Missed warning signs before production failures
According to Google’s Site Reliability Engineering (SRE) principles, proactive monitoring significantly reduces Mean Time to Detect (MTTD) and Mean Time to Resolve (MTTR), improving overall service reliability.
Why Monitor Kubernetes Clusters?
Implementing Kubernetes Performance Monitoring enables engineering teams to identify issues before users experience them.
1. Track Cluster and Node Health
Monitor the health of worker nodes, control plane components, and cluster services to ensure workloads remain available.
Benefits include:
- Node availability
- API server health
- Scheduler performance
- etcd status
- Cluster capacity
2. Monitor CPU and Memory Usage
Resource consumption changes continuously as applications scale.
Tracking CPU and memory helps teams:
- Prevent resource exhaustion
- Optimize infrastructure costs
- Detect memory leaks
- Right-size workloads
3. Detect Pod Failures and Restarts
Frequent pod restarts usually indicate:
- Application crashes
- Failed health checks
- Image issues
- Insufficient resources
- Configuration errors
Monitoring restart counts allows engineers to fix issues before users notice service degradation.
4. Receive Proactive Alerts Before Outages
Instead of discovering failures through customer complaints, Alertmanager can notify engineers instantly when thresholds are exceeded.
Examples include:
- High CPU utilization
- Pod CrashLoopBackOff
- Node Not Ready
- Disk nearing capacity
- High application latency
Why Prometheus and Grafana?
When discussing Prometheus Kubernetes Monitoring, Prometheus and Grafana remain the industry standard because they are open-source, scalable, and Kubernetes-native.
Prometheus
Prometheus automatically discovers Kubernetes resources and continuously collects metrics using a pull-based model.
Key capabilities:
- Time-series database
- Powerful PromQL queries
- Service discovery
- Alerting rules
- Kubernetes integration
Grafana
Grafana transforms raw metrics into meaningful dashboards that help teams understand cluster behavior.
Capabilities include:
- Interactive dashboards
- Real-time visualization
- Multi-source data support
- Custom alerts
- Executive reporting
Together, they form one of the most widely adopted Kubernetes Observability Tools for production environments.
How Kubernetes Monitoring Works
Understanding How to Monitor Kubernetes Clusters Using Prometheus and Grafana becomes easier with the following workflow.
+———————-+
| Kubernetes Cluster |
| Nodes • Pods • Apps |
+———-+———–+
|
Metrics Collection
|
+————-+
| Prometheus |
+————-+
|
Alert Rules & Time-Series Data
| |
+—————+ +—————+
| Alertmanager | | Grafana |
+—————+ +—————+
| |
Email • Slack • Teams Dashboards & Reports
This architecture enables complete observability across infrastructure, workloads, and applications.
Quick Setup Using Helm
Deploying the monitoring stack is straightforward using Helm.
helm repo add prometheus-community https://prometheus-community.github.io/helm-charts
helm install monitoring prometheus-community/kube-prometheus-stack
The installation includes:
- Prometheus
- Grafana
- Alertmanager
- Node Exporter
- kube-state-metrics
This provides a production-ready monitoring stack with minimal configuration.
Essential Kubernetes Metrics to Monitor
A successful Grafana Kubernetes Dashboard should include these critical metrics.
Node CPU & Memory
Monitor:
- CPU utilization
- Memory consumption
- Node load
- Available memory
Pod Status & Restarts
Track:
- Running pods
- Pending pods
- Failed pods
- Restart counts
- CrashLoopBackOff events
Disk Usage
Monitor:
- Persistent Volume utilization
- Node disk usage
- Storage latency
- Filesystem capacity
Network Traffic
Track:
- Ingress traffic
- Egress traffic
- Network latency
- Packet loss
- Throughput
Application Response Time
Application-level monitoring should include:
- HTTP latency
- Error rate
- Request throughput
- API availability
- Service response times
Google recommends monitoring the four golden signals:
- Latency
- Traffic
- Errors
- Saturation
These metrics provide an excellent foundation for Kubernetes Monitoring Best Practices.
Prometheus vs Grafana vs Alertmanager
| Feature | Prometheus | Grafana | Alertmanager |
| Primary Role | Metrics Collection | Visualization | Alert Management |
| Stores Metrics | Yes | No | No |
| Dashboards | Basic | Advanced | No |
| Alert Routing | Limited | Basic | Advanced |
| Best For | Monitoring | Analytics | Notifications |
Together, these three tools provide complete Kubernetes observability.
Real-World Use Case
An eCommerce platform running hundreds of Kubernetes pods noticed occasional checkout failures during seasonal traffic spikes.
After implementing Prometheus Kubernetes Monitoring with Grafana dashboards, the DevOps team identified CPU saturation on two worker nodes before peak shopping hours.
Using automated alerts and resource scaling, they:
- Reduced incident response time by over 60%
- Improved application uptime
- Prevented customer-facing outages during high traffic events
Best Practices for Kubernetes Monitoring
To maximize monitoring effectiveness:
- Configure Alertmanager for proactive notifications.
- Use pre-built Grafana dashboards from the Kubernetes community.
- Monitor infrastructure and application metrics together.
- Review resource utilization regularly.
- Define Service Level Objectives (SLOs).
- Keep Prometheus, Grafana, and exporters updated.
- Archive long-term metrics for capacity planning.
- Continuously optimize alert thresholds to reduce alert fatigue.
Industry Trends
The future of Kubernetes Cluster Monitoring is moving beyond dashboards toward intelligent observability.
Emerging trends include:
- AI-powered anomaly detection
- Predictive capacity planning
- OpenTelemetry integration
- Unified observability platforms
- Automated root cause analysis
- Cost-aware Kubernetes monitoring (FinOps)
According to Gartner, organizations increasingly prioritize observability platforms that combine metrics, logs, traces, and AI-driven insights into a single operational view.
Common Kubernetes Monitoring Challenges and How to Overcome Them
Even with a robust monitoring stack, organizations often encounter challenges that reduce the effectiveness of their observability strategy. Recognizing these issues early helps maintain reliable and high-performing Kubernetes environments.
Alert Fatigue
Poorly configured alert thresholds can overwhelm operations teams with unnecessary notifications, making it difficult to identify critical incidents. Fine-tuning Alertmanager rules and prioritizing alerts based on severity helps reduce noise while ensuring important issues receive immediate attention.
High Metrics Cardinality
As Kubernetes environments grow, the number of metrics and labels can increase significantly, leading to higher storage requirements and slower query performance. Regularly reviewing metric collection policies and removing unnecessary labels helps keep Prometheus efficient and scalable.
Limited Application Visibility
Infrastructure metrics alone do not provide a complete picture of application health. Combining Prometheus metrics with application instrumentation and distributed tracing offers deeper insights into request latency, service dependencies, and end-user experience.
Capacity Planning Challenges
Without historical performance data, teams often struggle to predict future infrastructure needs. Long-term metric retention and trend analysis enable informed decisions about resource allocation, autoscaling policies, and infrastructure investments.
Security and Access Control
Monitoring systems contain valuable operational data and should be secured using role-based access control (RBAC), encrypted communication, and regular software updates. Restricting dashboard access and protecting sensitive metrics helps maintain compliance and reduce security risks.
By addressing these challenges proactively, organizations can build a resilient monitoring strategy that not only detects issues quickly but also supports continuous optimization, better resource utilization, and improved application reliability across production Kubernetes clusters.
Final Verdict
Kubernetes Monitoring with Prometheus and Grafana provides real-time visibility into clusters, applications, and infrastructure, enabling organizations to detect issues before they impact users. By combining automated metric collection, intelligent dashboards, and proactive alerting, teams can improve application reliability, reduce downtime, optimize resource utilization, and accelerate incident response.
Organizations that invest in modern Kubernetes Observability Tools gain stronger operational resilience, lower infrastructure costs, and better customer experiences.
Optimize Your Kubernetes Operations with Expert Observability
Monitoring is only valuable when it leads to faster decisions and reliable production systems. If your organization is looking to improve Kubernetes performance, reduce downtime, and build production-grade observability, partnering with experienced Kubernetes and DevOps specialists can accelerate your journey. From deploying Prometheus and Grafana to configuring intelligent alerting and performance optimization, expert guidance helps you build a resilient, scalable, and highly available Kubernetes environment.
Frequently Asked Questions
To monitor Kubernetes clusters using Prometheus and Grafana, deploy the kube-prometheus-stack using Helm. Prometheus collects metrics from nodes, pods, and Kubernetes components, while Grafana visualizes the data through customizable dashboards. Together, they provide real-time visibility into cluster health, resource usage, and application performance. Prometheus and Grafana are the most widely adopted open-source tools for Kubernetes observability. Prometheus automatically collects time-series metrics, while Grafana converts them into interactive dashboards. This combination enables proactive alerting, faster troubleshooting, and better infrastructure optimization. The most critical metrics include CPU usage, memory utilization, pod health, restart counts, disk usage, network traffic, request latency, error rates, and node availability. Monitoring these metrics helps detect issues early and maintain reliable Kubernetes workloads. The simplest way to set up Kubernetes monitoring with Prometheus and Grafana is by installing the kube-prometheus-stack Helm chart. It deploys Prometheus, Grafana, Alertmanager, Node Exporter, and kube-state-metrics with production-ready configurations, reducing setup time significantly. Kubernetes monitoring best practices include configuring Alertmanager for proactive notifications, monitoring both infrastructure and application metrics, using pre-built Grafana dashboards, reviewing resource utilization regularly, defining Service Level Objectives (SLOs), and keeping Prometheus and Grafana updated for security and performance improvements.1. How do you monitor Kubernetes clusters using Prometheus and Grafana?
2. Why should I use Prometheus and Grafana for Kubernetes monitoring?
3. What are the most important Kubernetes metrics to monitor?
4. What is the easiest way to set up Kubernetes monitoring with Prometheus and Grafana?
5. What are the best practices for Kubernetes monitoring in production?